
Day after day you provide treatment plans to patients. But do you know how many patients actually scheduled appointments and how much production you have on the books? The Unscheduled Treatment – Pie Chart report is a great way for you to see an overview of unscheduled treatment for each provider or location in your organization.
To See an Overview for Each Provider:
- On the Home menu, select Insights.
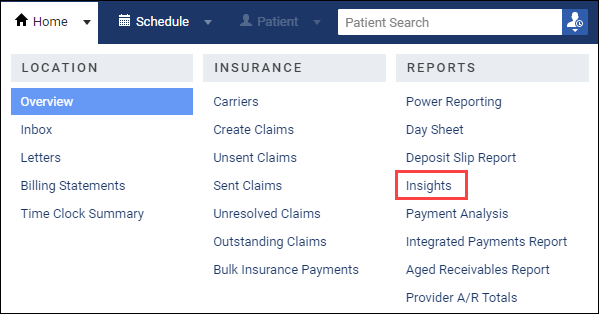
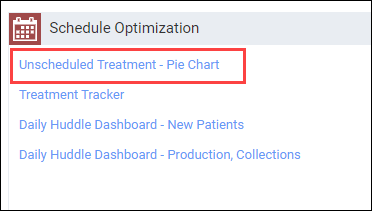
- On the Insights page, click Unscheduled Treatment – Pie Chart in the Schedule Optimization widget.
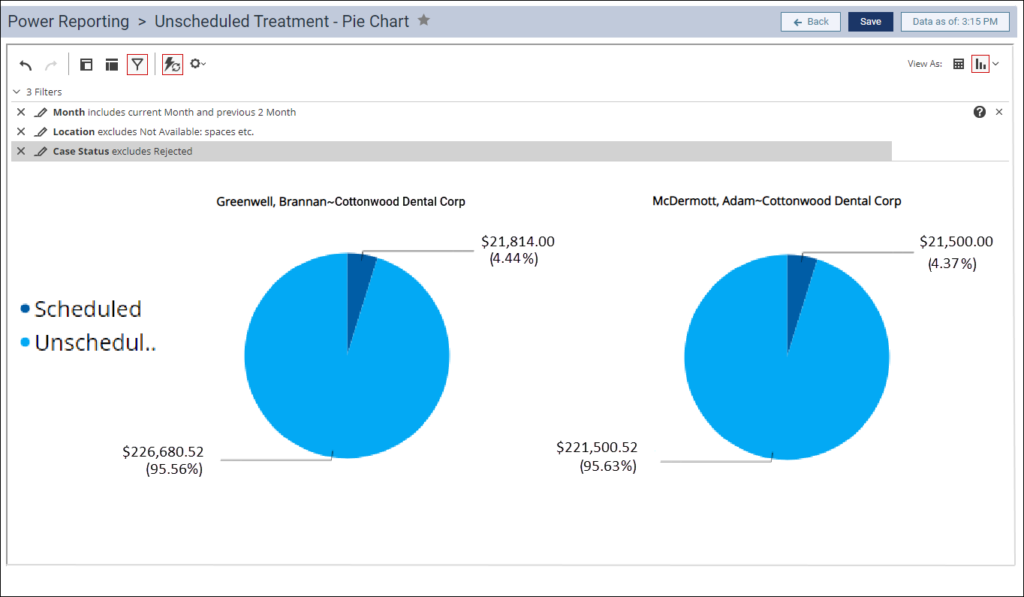
The Unscheduled Treatment – Pie Chart Report opens and displays the amount and the percentage of unscheduled and scheduled treatment-planned procedures for each provider. By default, the date range is for the current month and the two months previous.
To See an Overview of Each Location
You can modify the Unscheduled Treatment – Pie Chart Report to see an overview of unscheduled treatment for each location.
- To remove providers from the report, click the Rearrange fields on the report icon.
- Under the Multi-Pie Layout, right-click the Provider field, and select Remove from Report.
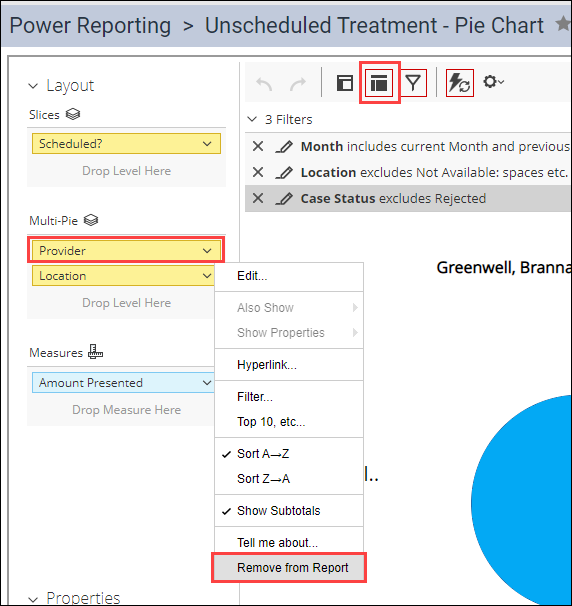
- Click Refresh Report to update the report.
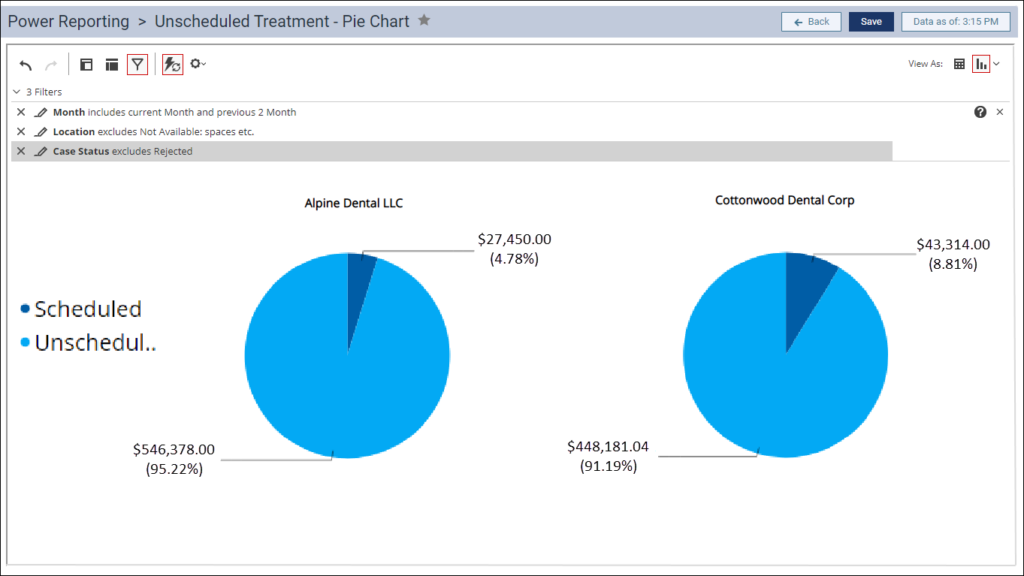
The Unscheduled Treatment – Pie Chart Report displays the amount and the percentage of unscheduled and scheduled treatment-planned procedures for each location.
Additional Information
- To learn more about using this report, read Unscheduled Treatment – Pie Chart Report.
- To learn more about how to determine which patients have unscheduled treatment with remaining benefits, watch Finding Patients with Outstanding Treatment from the End-of-Year Best Practices webinar.