
All you data-visualization gurus out there will love this Power Reporting tip. Did you know you can view your Power Reporting data as a bar chart, line graph, scatter plot, and many other formats? With a few easy clicks, you can filter a Power Report to show only the data you want. Then, you can choose from a selection of charts to display the data how you want. It’s a data-visualization dream. Let’s learn how it works.
How It Works
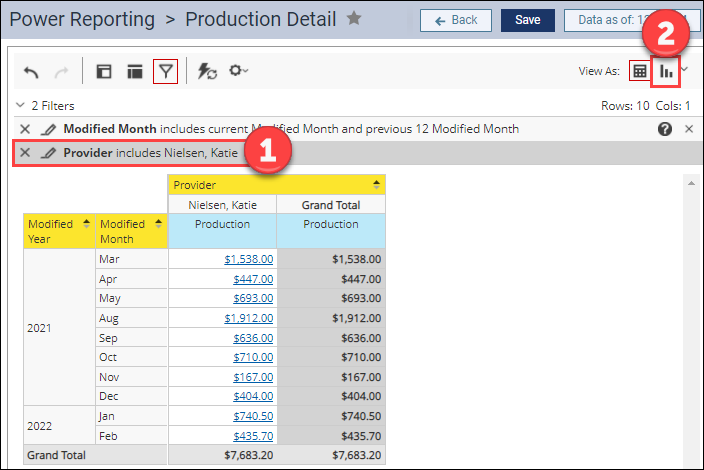
- Set up filters to show only the data you want in the report. For help with filtering, see Using Filters to Customize Power Reports.
- Click the chart format icon to see the data as a chart. (Note: Click the icon again to return to the table format.)
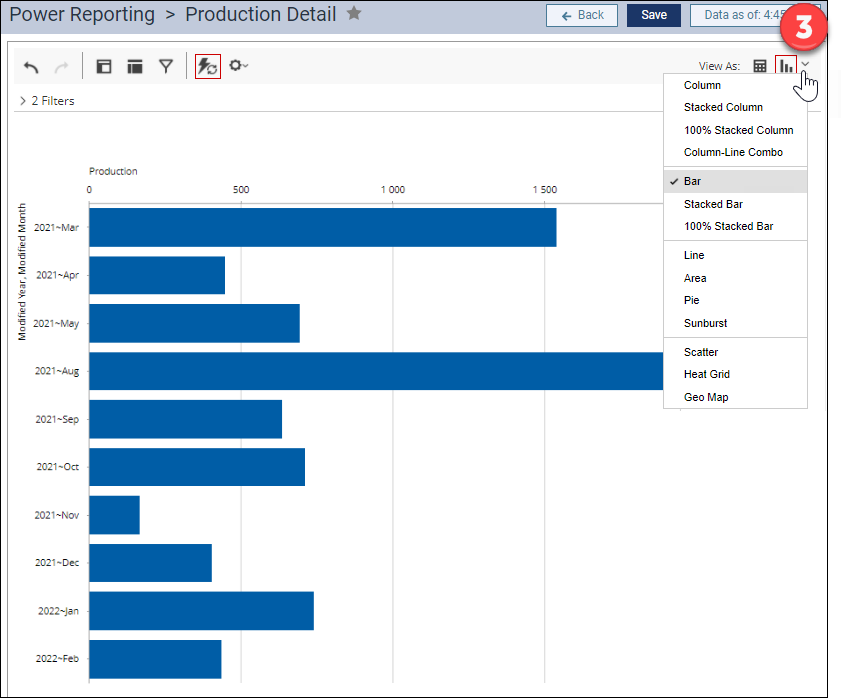
- Click the arrow next to the chart format option to see the list of available chart types. Select the chart type that matches how you want to display the data.
Additional Information
- Data visualization is only available for analysis-type reports, which include measures.
- To learn more about adding filters to reports, read Using Filters to Customize Power Reports in the Dentrix Ascend Blog.
- The chart options in Power Reporting include:
- Column, Stacked Column, 100% Stacked Column, Column-Line Combo
- Bar, Stacked Bar, 100% Stacked Bar
- Line, Area, Pie, Sunburst
- Scatter, Heat Grid, Geo Map